
Guides · November 21, 2026 · 11 min read
Lowest-Sugar Kids' Cereal: 12 Brands Ranked by Label
Original Cheerios lists 2 g sugar per 1 1/2 cup; Apple Jacks lists 13 g per 1 1/3 cup. See where Froot Loops, Kix and 8 more land, by label.
By Chris Carrillo · Reviewed by Armin Rad, Co-Founder & CTO, Aurascan · November 21, 2026
Every article is checked against primary sources before publication. How we review
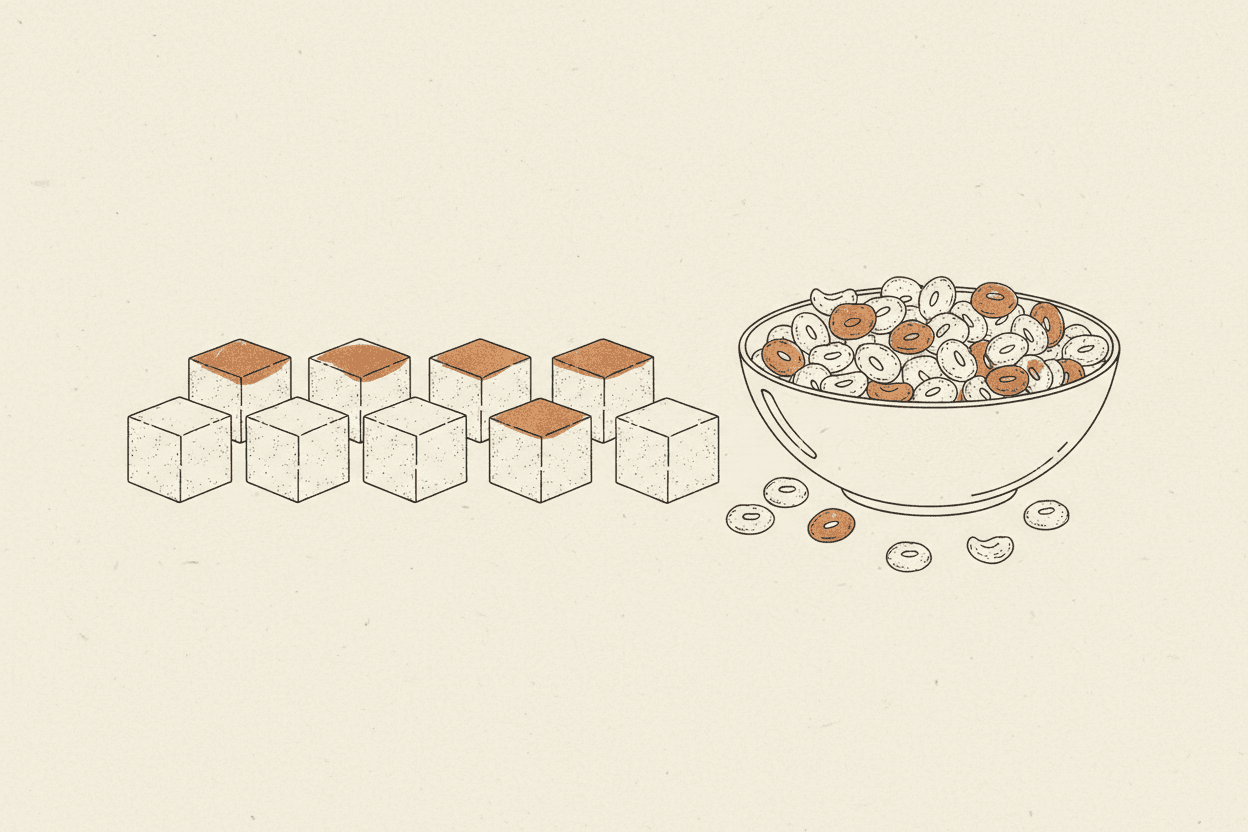
Original Cheerios lists the least total sugar of the 12 popular US kids' cereals ranked here, at 2 g per 1 1/2 cup serving. Rice Krispies and Kix come next at 4 g each, while eight cereals list 12 g per serving and Apple Jacks lists 13 g. Because serving sizes range from 36 g to 60 g, the per-100 g column, computed from printed serving weights, shows differences that per-serving numbers can hide.
Key takeaways
- Cereals are ranked by fewest grams of total sugars per labeled serving. Ties are broken by grams per 100 g, computed from the printed serving weight.
- Original Cheerios lists 2 g sugar, 1 g added sugars (2% DV), 190 mg sodium, 4 g fiber and 5 g protein per 1 1/2 cup.
- Per-100 g figures are computed from printed serving weights. They are not label values.
- Read added sugars %DV, sodium, fiber and protein alongside total sugar, not on their own.
How We Ranked These 12 Kids' Cereals: Selection Criteria in Plain Words
The ranking rule is straightforward: cereals are ordered by the fewest grams of total sugars per labeled serving, the figure printed on the package or brand page. Ties are broken by grams of sugar per 100 g, computed by dividing the sugar by the printed serving weight.
Serving sizes differ, from 1 cup to 1 1/2 cups and from 36 g to 60 g, so a cup measure alone can mislead. Brand pages often give only cup measures. Where a gram weight is needed, we used the figure from the Open Food Facts entry for that cereal and labeled the result as computed.
The FDA's added sugars page gives a reference point for the %DV column. According to that page, the Daily Value is stated this way: "The Daily Value for added sugars is 50 grams per day based on a 2,000 calorie daily diet." (Source: FDA, Added Sugars on the Nutrition Facts Label). The same page describes 5% DV or less as a low source and 20% DV or more as a high source of added sugars. By that yardstick, Original Cheerios at 2% DV is low, and the seven cereals printing 24 to 26% DV are high. Rice Krispies at 8% DV sits between those two reference points; this list does not classify it.
Ranking Table: All 12 Cereals by Grams of Sugar per Labeled Serving
Original Cheerios has the least total sugar per labeled serving of the 12 cereals, at 2 g per 1 1/2 cup serving, followed by Rice Krispies and Kix at 4 g each.
Eight cereals print the same 12 g of total sugar per serving, and the per-100 g column shows how far apart they actually are.
| Rank | Product | Serving size | Total sugars per serving | Sugar per 100 g (computed) | Sodium | Added sugars %DV |
|---|---|---|---|---|---|---|
| 1 | Original Cheerios | 1 1/2 cup (39 g per Open Food Facts) | 2 g | 5.1 g | 190 mg | 2% |
| 2= | Kellogg's Rice Krispies | 1 1/2 cup (40 g) | 4 g | 10.0 g | 200 mg | 8% |
| 2= | Kix | 40 g | 4 g | 10.0 g | 220 mg | Not disclosed |
| 4 | Kellogg's Frosted Mini-Wheats Bite Size | 25 biscuits (60 g) | 12 g | 20.0 g | 10 mg | 24% |
| 5 | Cinnamon Toast Crunch | 1 cup (41 g per Open Food Facts) | 12 g | 29.3 g | 230 mg | 24% |
| 6= | Kellogg's Froot Loops | 1 1/3 cup (39 g) | 12 g | 30.8 g | 210 mg | 24% |
| 6= | Trix | 39 g | 12 g | 30.8 g | 180 mg | Not disclosed |
| 8= | Honey Nut Cheerios | 1 cup (37 g per Open Food Facts) | 12 g | 32.4 g | 210 mg | 24% |
| 8= | Kellogg's Frosted Flakes | 1 cup (37 g) | 12 g | 32.4 g | 190 mg | 24% |
| 10= | Fruity Pebbles | 1 cup (36 g) | 12 g | 33.3 g | 190 mg | 25% as printed |
| 10= | Cocoa Puffs | 36 g | 12 g | 33.3 g | 120 mg | Not disclosed |
| 12 | Kellogg's Apple Jacks | 1 1/3 cup (39 g) | 13 g | 33.3 g | 210 mg | 26% |
Which kids' cereal has less sugar?
Original Cheerios has less total sugar per labeled serving than any other cereal in this set, with 2 g per 1 1/2 cup serving. Rice Krispies and Kix are next at 4 g each. Per 100 g, Kix and Rice Krispies both compute to 10.0 g, which is far below the 12 g cereals.
1. Original Cheerios: Lowest Sugar at 2 g per 1 1/2 Cup Serving
Original Cheerios lists 2 g of total sugars per 1 1/2 cup serving, the lowest figure in this set. Open Food Facts gives that serving as 39 g, which computes to 5.1 g per 100 g.
The label also shows 1 g of added sugars (2% DV), 140 calories, 190 mg sodium, 4 g fiber and 5 g protein. The General Mills product page lists the cereal in 8.9 oz packaging and gives its serving in cups, so the gram weight comes from the Open Food Facts entry (Cheerios product page; Open Food Facts).
2= Kellogg's Rice Krispies: 4 g Sugar per 1 1/2 Cup Serving, All Added
Kellogg's Rice Krispies lists 4 g of total sugars per 1 1/2 cup (40 g) serving, and all 4 g are added sugars at 8% DV. Per 100 g, the computed figure is 10.0 g.
The panel shows 150 calories, 200 mg sodium, 0 g fiber and 3 g protein. Its 0 g fiber compares with 4 g for Original Cheerios and 6 g for Frosted Mini-Wheats Bite Size (Kellogg's SmartLabel).
2= Kix: 4 g Sugar per 40 g Serving, With 3 g Fiber
Kix lists 4 g of total sugars and 4 g of added sugars per 40 g serving, with 3 g of fiber. Computed per 100 g, that is 10.0 g.
The entry shows 220 mg sodium, 20 mg more than Rice Krispies, and 3 g protein. Calories are not disclosed for Kix, and its added sugars %DV is not disclosed (Open Food Facts).
4. Kellogg's Frosted Mini-Wheats Bite Size: 12 g Sugar per 25-Biscuit Serving
Frosted Mini-Wheats Bite Size lists 12 g of total sugars per 25-biscuit serving (60 g), which computes to 20.0 g per 100 g. That is the lowest per-100 g figure among the cereals listing 12 g per serving.
The label shows 12 g of added sugars (24% DV), 210 calories, 10 mg sodium, 6 g fiber and 5 g protein. Per 100 g, Frosted Mini-Wheats computes 13.3 g lower than Apple Jacks at 33.3 g, even though their per-serving totals differ by only 1 g (Kellogg's SmartLabel).
5. Cinnamon Toast Crunch: 12 g Sugar per 1 Cup Serving, 29.3 g per 100 g
Cinnamon Toast Crunch lists 12 g of total sugars per 1 cup serving, all of it added sugars at 24% DV. Open Food Facts gives the cup as 41 g, which computes to 29.3 g per 100 g.
The panel shows 170 calories, 230 mg sodium, 3 g fiber and 2 g protein. Readers comparing it with a similar cereal can see a side-by-side breakdown in Which Has More Sugar, CTC or Golden Grahams? 12 g a Cup (Cinnamon Toast Crunch product page; Open Food Facts).
6= Kellogg's Froot Loops: 12 g Sugar per 1 1/3 Cup Serving, 30.8 g per 100 g
Froot Loops lists 12 g of total sugars per 1 1/3 cup serving (39 g), which computes to 30.8 g per 100 g.
How much sugar is in Froot Loops per serving?
One labeled serving of Froot Loops (1 1/3 cup, 39 g) lists 12 g of total sugars, all of it added sugars at 24% DV. The label also shows 150 calories, 210 mg sodium, 3 g fiber and 2 g protein. The label does not show what a bowl holds when a child pours more than one serving, so per-bowl sugar is not disclosed here (Kellogg's SmartLabel).
6= Trix: 12 g Sugar per 39 g Serving, Sodium 180 mg
Trix lists 12 g of total sugars per 39 g serving, with 180 mg of sodium. That sodium figure is lower than the 210 to 230 mg printed by Froot Loops, Honey Nut Cheerios and Cinnamon Toast Crunch.
The entry shows 160 calories, 1 g fiber and 2 g protein. Trix's added sugars amount and %DV are not disclosed (Open Food Facts).
8= Honey Nut Cheerios: 12 g Sugar per 1 Cup Serving, 32.4 g per 100 g
Honey Nut Cheerios lists 12 g of total sugars and 12 g of added sugars (24% DV) per 1 cup serving. Open Food Facts gives that cup as 37 g, which computes to 32.4 g per 100 g.
The label also shows 140 calories, 210 mg sodium, 3 g fiber and 3 g protein (Cheerios product page; Open Food Facts).
How much sugar is in Honey Nut Cheerios vs regular Cheerios?
Honey Nut Cheerios lists 12 g of total sugars per 1 cup serving, while Original Cheerios lists 2 g per 1 1/2 cup serving, a 10 g difference in the labeled figures. The serving sizes differ, so the computed per-100 g figures are more direct: 32.4 g for Honey Nut and 5.1 g for Original.
8= Kellogg's Frosted Flakes: 12 g Sugar per 1 Cup Serving, 32.4 g per 100 g
Frosted Flakes lists 12 g of total sugars and 12 g of added sugars (24% DV) per 1 cup (37 g) serving, which computes to 32.4 g per 100 g.
The panel shows 130 calories, the lowest calorie count among the 12 g cereals, along with 190 mg sodium, 1 g fiber and 2 g protein (Kellogg's SmartLabel).
10= Fruity Pebbles: 12 g Sugar per 1 Cup Serving, 33.3 g per 100 g
Post Fruity Pebbles lists 12 g of total sugars per 1 cup serving (36 g), which computes to 33.3 g per 100 g. The label prints 12 g of added sugars at 25% DV.
The label also shows 140 calories, 190 mg sodium, 0 g fiber and 1 g protein. Other flavors and sizes, such as marshmallow varieties, are outside this list and their sugar figures are not covered here (Pebbles product page).
10= Cocoa Puffs: 12 g Sugar per 36 g Serving, 33.3 g per 100 g
Cocoa Puffs lists 12 g of total sugars and 12 g of added sugars per 36 g serving, which computes to 33.3 g per 100 g. The entry shows 140 calories, 120 mg sodium, 2 g fiber and 2 g protein. The added sugars %DV is not disclosed (Open Food Facts).
12. Kellogg's Apple Jacks: 13 g Sugar per 1 1/3 Cup Serving, 33.3 g per 100 g
Apple Jacks lists 13 g of total sugars per 1 1/3 cup serving (39 g), the highest total in this set, which computes to 33.3 g per 100 g. Its added sugars are also 13 g, at 26% DV.
The panel shows 150 calories, 210 mg sodium, 3 g fiber and 2 g protein (Kellogg's SmartLabel).
Common Questions About Low-Sugar Kids' Cereals
What cereals are the lowest in sugar?
In this set, Original Cheerios lists the lowest total sugar at 2 g per 1 1/2 cup serving (39 g per Open Food Facts). Kellogg's Rice Krispies and Kix come next at 4 g each per labeled serving.
What is a good low sugar cereal?
Original Cheerios lists the lowest sugar figures in this list, with 2 g of total sugar and 1 g of added sugars (2% DV) per 1 1/2 cup serving. Rice Krispies and Kix also list 4 g of total sugar each, though Kix does not disclose its added sugars %DV.
Is there a healthiest kids' cereal?
This list cannot establish a healthiest cereal. It ranks total sugar per labeled serving only, and the evidence here does not weigh sodium, fiber, protein and added sugars together into an overall judgment.
How to Use This List
Start with total sugars per labeled serving, then check the serving size in grams, since two cereals with the same per-serving number can differ widely per 100 g. Next, read added sugars and %DV, which show how much of the total sugar is added sugars.
- Check the serving size in cups and grams before comparing bowls.
- Compare sugar per 100 g when serving sizes differ.
- Read sodium, fiber and protein beside sugar, not after it.
- Note whether a cereal prints a %DV for added sugars, and whether that figure is disclosed.
- Remember that a child may pour more than one serving.
For sugar in other kids' snacks and fruit products, Dole vs Del Monte Fruit Cups: Sugar, Gel and Juice shows how labeled sugar figures compare across packaged options, and Do Larabars Have Added Sugar? Larabar vs That's It Bars shows how to read the added sugars line.
These figures come from brand pages and Open Food Facts entries and describe one labeled serving. They cannot show how much any particular child eats, how a cereal affects any individual, or what a child's total daily sugar intake looks like, and this list does not make health claims about these cereals.
Try Aurascan
See what is really in the food you buy.


Common questions
- Which kids cereal has less sugar?
- Original Cheerios has the least total sugar in this set of 12, at 2 g per 1 1/2 cup serving. Rice Krispies and Kix come next at 4 g each.
- What cereals are the lowest in sugar?
- In this set, Original Cheerios (2 g per 1 1/2 cup), then Kellogg's Rice Krispies and Kix (4 g each) list the lowest total sugars per labeled serving.
- What is the healthiest children's cereal?
- This list ranks cereals by total sugar per labeled serving and cannot identify a healthiest cereal. Sodium, fiber, protein and added sugars %DV should also be read from the Nutrition Facts panel.
- What is a good low sugar cereal?
- Among the cereals listed here, Original Cheerios lists 2 g of total sugar and 1 g of added sugars per 1 1/2 cup serving, and Rice Krispies and Kix list 4 g each.
- How much sugar is in Froot Loops per serving?
- Froot Loops lists 12 g of total sugars per 1 1/3 cup serving (39 g), all of it added sugars at 24% DV.
- How much sugar is in Honey Nut Cheerios vs regular?
- Honey Nut Cheerios lists 12 g of total sugars per 1 cup serving (37 g per Open Food Facts), while Original Cheerios lists 2 g per 1 1/2 cup serving (39 g per Open Food Facts).
- What is the daily value for added sugars?
- The FDA states: "The Daily Value for added sugars is 50 grams per day based on a 2,000 calorie daily diet." The FDA page also describes 5% DV or less as low and 20% DV or more as high.
Sources
- Added Sugars on the Nutrition Facts Label (fda.gov)
- Original Cheerios (cheerios.com)
- Honey Nut Cheerios 15.4 oz (cheerios.com)
- Cinnamon Toast Crunch (cinnamontoastcrunch.com)
- Fruity Pebbles (pebblescereal.com)
- Kellogg's Rice Krispies SmartLabel (smartlabel.wkkellogg.com)
- Kellogg's Frosted Mini-Wheats Bite Size SmartLabel (smartlabel.wkkellogg.com)
- Kellogg's Froot Loops SmartLabel (smartlabel.wkkellogg.com)
- Kellogg's Frosted Flakes SmartLabel (smartlabel.wkkellogg.com)
- Kellogg's Apple Jacks SmartLabel (smartlabel.wkkellogg.com)
- Kix on Open Food Facts (world.openfoodfacts.org)
- Trix on Open Food Facts (world.openfoodfacts.org)
- Cocoa Puffs - Open Food Facts (world.openfoodfacts.org)
- Cheerios - Open Food Facts (world.openfoodfacts.org)
- Honey Nut Cheerios - Open Food Facts (world.openfoodfacts.org)
- Cinnamon Toast Crunch - Open Food Facts (world.openfoodfacts.org)
In this series
Guide
We Read 151 Cracker Labels: 123 List Seed OilsGuide
Which Has More Sugar, CTC or Golden Grahams? 12 g a CupGuide
Are Saltines Dairy Free? Premium vs Zesta: No Milk ListedGuide
Are Planters Peanuts Vegan? Gelatin in Dry Roasted vs 365Guide
Do Larabars Have Added Sugar? Larabar vs That's It BarsGuide
Do Rice Krispies Treats Have Gelatin? Annie's Uses Agar
Related guides
Comparisons
Royal Dansk or Kjeldsens? Only One Lists Egg YolkPer 4 cookies (30 g) both tins list 150 calories and 8 g sugars; Kjeldsens adds currants and dried egg yolk, Royal Dansk lists eggs only as a may-contain.
Comparisons
Are Saltines Dairy Free? Premium vs Zesta: No Milk ListedPremium and Zesta Original saltines list no milk ingredient. Premium says Contains: Wheat; Zesta says wheat and soy. Sodium per 5 crackers: 135 mg vs 220 mg.
Guides
We Read 151 Cracker Labels: 123 List Seed OilsYes, most crackers have seed oils: 123 of 151 US cracker labels list canola, sunflower, soybean or safflower oil. See which 28 don't, brand by brand.
Try it on your own groceries
Scan your next label with Aurascan
Point the camera at any ingredient list and get the same evidence-graded read you see here.
Get food recall alerts + a weekly digest
An email when a food recall is announced, plus one weekly roundup of label news and new guides.
We email a confirmation link first - nothing is sent until you click it. Unsubscribe anytime. Privacy